
2026 Compensation & Benefits Survey
Florida Nonprofit Alliance, in partnership with 14 organizations across the state, is pleased to present the 2026 Florida Nonprofit Compensation & Benefits Survey Report, the first comprehensive, statewide study of compensation and benefits practices in Florida’s nonprofit sector,
This report, together with its companion compensation data dashboard, provides benchmarking data for a wide range of nonprofit positions across organizations of varying sizes throughout Florida.
The findings are designed to help Florida nonprofits demonstrate sound management to grantmakers, donors, and community stakeholders, and to support more informed hiring, retention, and budgeting decisions. Just as important, the data helps organizations ensure their compensation practices remain competitive and aligned with the market.
EXPLORE THE FULL REPORT:
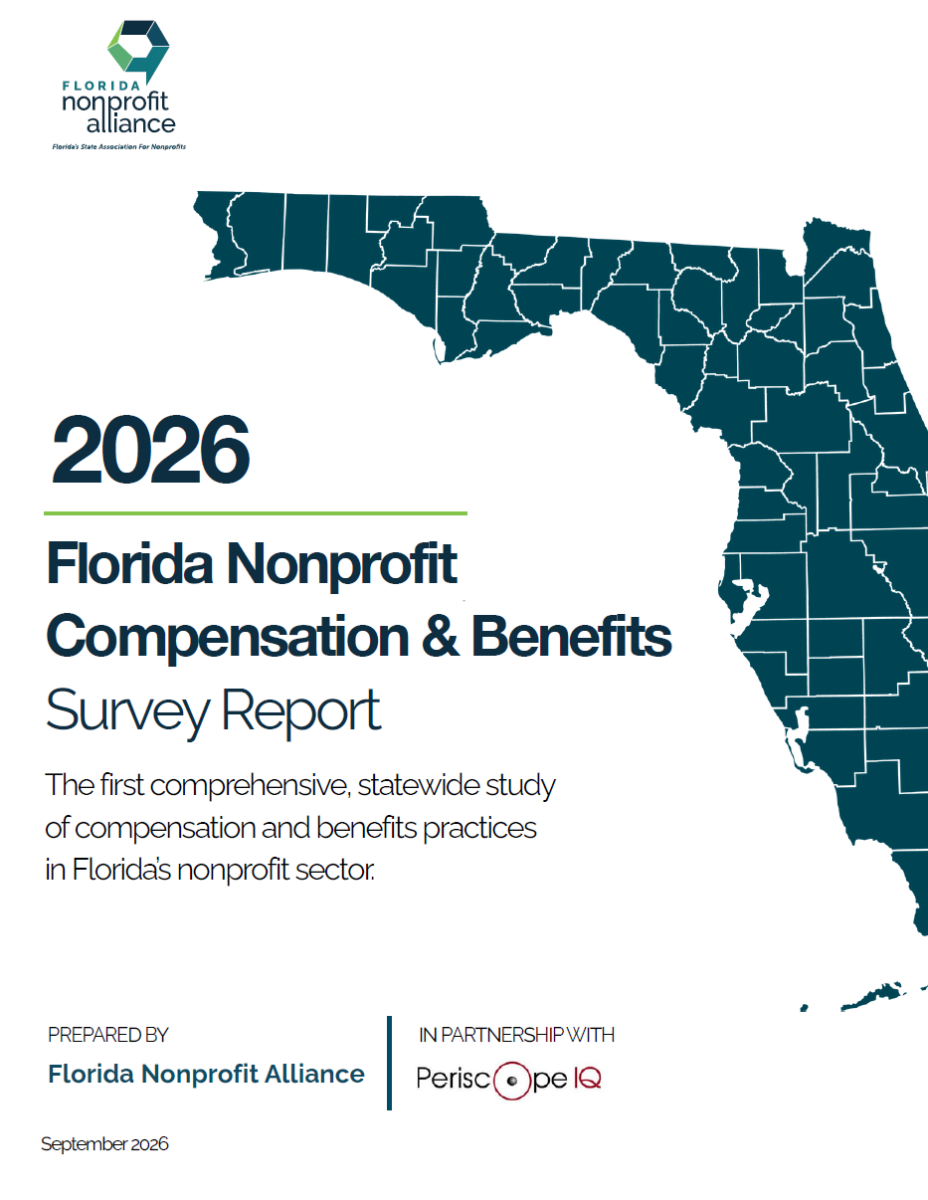
2026 Florida Nonprofit Compensation & Benefits Survey Report
The 2026 Compensation & Benefits Survey Report provides a comprehensive snapshot of how Florida’s nonprofit organizations attract, reward, and retain their workforce. This year’s findings reflect a sector navigating economic pressures, evolving employee expectations, and a continued focus on equity and sustainability.
Download
Data Dashboard
Findings from the report can be viewed through the accompanying compensation data dashboard, allowing employers and jobseekers to explore salary benchmarks for nonprofit positions across Florida and compare compensation by varying factors, including organization size and geography, where sufficient data is available.
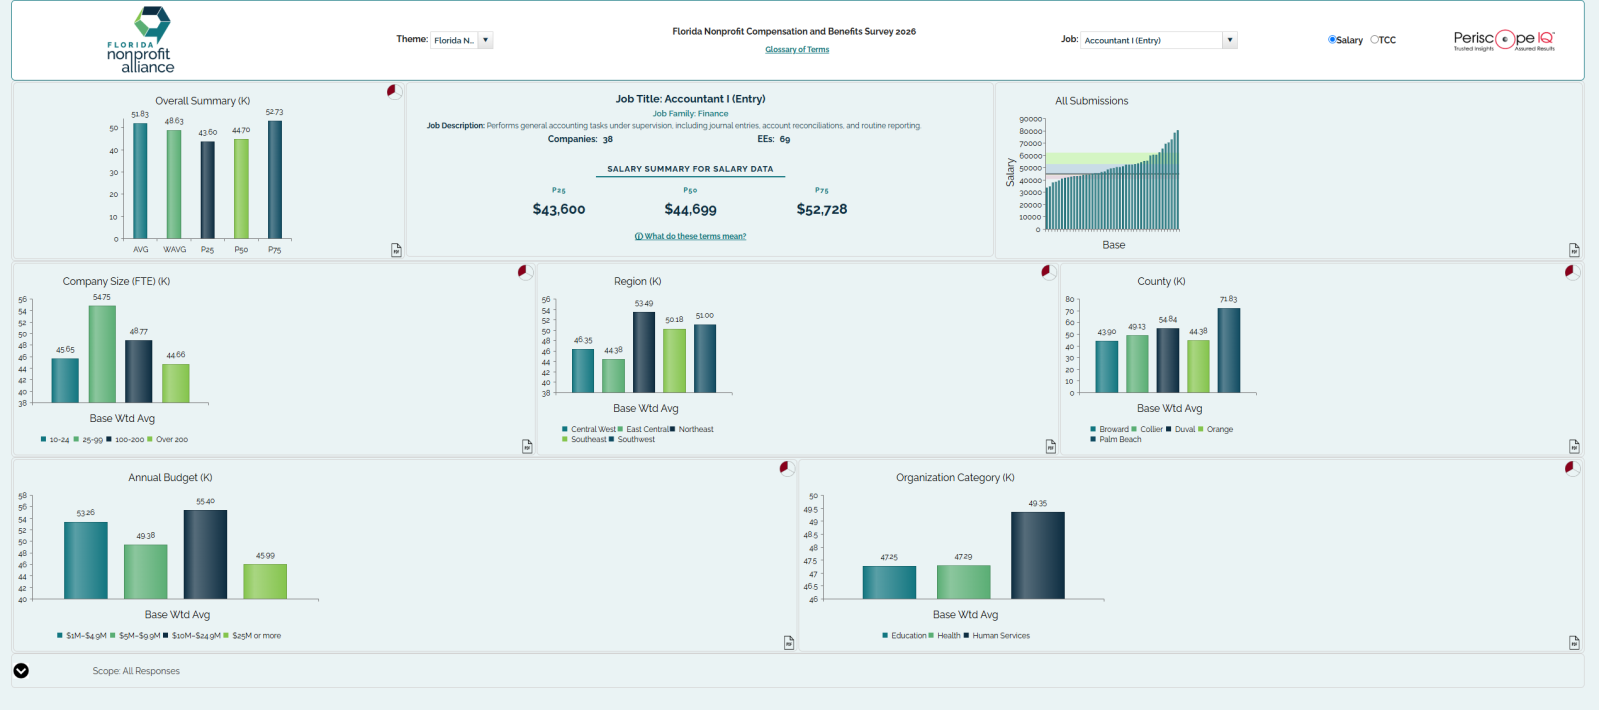
View the Dashboard
For questions on using the data dashboard, please contact Leah McDermott at lmcdermott@flnonprofits.org.
Key Findings
Pay is the Sector's Central Workforce Challenge
It is the leading reason positions are hard to both recruit and retain, and 70% of organizations that struggle to hire cite an inability to match candidates’ expected salaries. Where a barrier is named, pay dominates every other factor — appearing in 43% of “hardest to fill” and 48% of “hardest to retain” responses.
Workplace Flexibility is now Standard Practice for Nonprofit Employers
Hybrid work is the most common arrangement, offered by 62% of organizations, and where it is offered it usually extends to all staff rather than select job types. These arrangements also appear durable: 93% of nonprofits do not expect to bring remote or hybrid employees fully back in-person in the next 12 months.
Nonprofits Understand the Responsibility of Investing in their Employees
More than four in five organizations (82%) gave a raise in 2025, and the typical organization plans a 3% increase this year. Core benefits are widely provided and holding steady — three-quarters offer medical coverage and two-thirds offer retirement plans — and most kept their benefits package unchanged year-over-year (71%), with improvements (27%) far outnumbering reductions (2%).
Leadership Change is on the Horizon for many Organizations
About 18% of nonprofits changed their CEO in the last two years, and another 7% expect a change in the coming year — meaning roughly a quarter will see an executive transition over a three-year span. Turnover in other roles ran near 16%, the majority of it voluntary, with development/fundraising and program delivery/management the hardest positions to fill and retain. When nonprofits do hire new leaders, they draw overwhelmingly from within the sector (89%) and from their local community (84%) — yet only 43% have a formal succession plan in place.
Considerations for the Sector
The findings point to several areas where nonprofit leaders and boards can strengthen their approach to compensation, retention, hiring practices, and workforce planning. The following considerations offer actionable opportunities to use this research to inform internal policies.
Draft a Written Compensation Philosophy
Only 37.5% of participating organizations have a formal written compensation philosophy. A written approach identifies salary bands, sets the process for salary increases, determines incentive structures, addresses internal pay equity, and creates consistency in compensation decisions.
Address the Factors Driving Employee Turnover
Among organizations identifying reasons positions are difficult to retain, 17% cited burnout, stress or workload, second only to compensation.
Pay matters, but compensation is not the only incentive available to organizations. Flexible schedules, benefits, professional development and opportunities for advancement should all be considered as part of an organization's approach to attracting and retaining employees.
Make Succession Planning an Organizational Priority
With roughly one-quarter of nonprofits experiencing or anticipating a CEO transition, succession planning should be part of organizational planning well before a departure occurs. This includes investing in professional development, cross-training, and establishing emergency plans for unexpected vacancies.
Incorporate Compensation and Benefits Into Strategic Planning
Compensation, benefits and other staffing practices affect an organization's ability to deliver its mission. Boards and executive leaders should incorporate workforce needs into strategic planning, budgeting and long-term financial decisions instead of treating them solely as HR matters.
Survey Design
The survey instrument comprised 137 questions spanning organizational classification, compensation philosophy, salary increases, incentives, executive compensation, benefits, leave, remote work, and workforce trends. The questionnaire was developed by PeriscopeIQ and reviewed with input from Florida Nonprofit Alliance and survey partners and was paired with a separate position-level compensation spreadsheet.
Data Collection
The survey was open from June 2, 2026 through July 21, 2026. Florida Nonprofit Alliance and the survey partners distributed it through membership communications, partner networks, and direct outreach across Florida. The survey was hosted on the PeriscopeIQ platform. Eligibility was limited to 501(c)(3) nonprofit organizations based in Florida with at least one paid staff member, and each organization could submit only one response.
Participation
• Total participating organizations: 395
• Geographic coverage: 35 of Florida’s 67 counties, across 8 regions
• Budget size range: under $50,000 to more than $50 million
• Position-level pay data: submitted by 266 organizations, representing 7 of the 8 regions
Data Analysis
For categorical questions, results are reported as the count and percentage of respondents selecting each option. For multi-select questions, percentages may sum to more than 100% because respondents could choose more than one option. For numeric questions, results are reported using a standard set of statistics: minimum, 25th percentile, median, average, 75th percentile, and maximum. The median is highlighted throughout as the primary benchmark, since it is less sensitive than the mean to unusually high or low values.
Outliers were reviewed but not automatically removed. Values that appeared to be data-entry errors (for example, a salary entered with an extra digit) were flagged and confirmed with the responding organization where possible; values that could not be verified were excluded from the affected calculation. Legitimate outliers reflecting genuine variation were retained — one reason the median is preferred as the headline statistic.
How Compensation Was Reported
To keep pay figures comparable across organizations, respondents were asked to report compensation on a common basis:
- Base salary — Reported as of April 1, 2026.
- Bonus / incentive — Any bonus or incentive pay provided during 2025 for performance during the prior fiscal year.
Confidentiality
Florida Nonprofit Alliance is committed to protecting the confidentiality of every organization that participated in this survey. All responses were collected and stored on the secure PeriscopeIQ survey platform, and no individual organization is identifiable in this report or in the companion dashboard. Several safeguards were applied to protect respondent privacy:
- Results are reported only in aggregate — never at the level of an individual organization or respondent.
- For the survey questions, any data cell representing fewer than five organizations has been suppressed and is shown as a dash or noted as insufficient sample. In the detailed compensation tables, where individual pay benchmarks are the primary value, positions are reported when at least three organizations responded and suppressed below that threshold.
- Identifying fields collected during the survey (organization name, address, primary contact) were used solely to verify eligibility, prevent duplicate submissions, and deliver results to participants — they are not included in any reported statistics.
- Open-ended responses that referenced specific organizations, programs, or individuals have been paraphrased or generalized in any qualitative themes reported.
Dominance Diffusion
U.S. Department of Justice guidelines suggest that survey providers report data in such a way that no single organization has more than 25% influence or weight in any reported statistic. This prevents a published figure from simply mirroring the data of one very dominant organization, which could raise antitrust concerns. Managing this dominance without a serious loss of data quality has long been a challenge in the industry.
PeriscopeIQ’s proprietary Dominance Diffusion process addresses this problem uniquely and without excessive loss of data quality. Throughout the compensation tables, statistics are shown in italics where one or more organizations were dominant for that data cut and Dominance Diffusion has been applied.
Limitations
Self-reported, voluntary data. Participation was voluntary and responses were not independently audited; organizations may interpret titles and benefit categories differently.
Uneven coverage. Response rates varied across mission areas, budgets, regions, and positions; benchmarks with smaller samples should be treated as directional.